Analyse web logs
Posted on Sat 17 June 2023 in FOSS
N.B. The scripts described in this article are available in a github repo as jupyter notebooks.
Web analytics are big business. Products like Google Analytics enable incredibly granular and detailed examination of every user to your website. However, if you do not wish to collect and retain data at this level using tools like cookies or tracking beacons, either out of respect to your users privacy or because it's the law, you need to do your own user analysis.
This blog explains the process I went through to analyse use traffic to my organisation's ERDDAP data server to get an idea of what data is being requested and where our users are. I approached this with the following priorities: 1. No third party trackers on the site 2. Aggregate data at the regional/national level to preserve anonymity 3. Search for trends in the data requests that users were making to guide our data sharing strategy
Step 0. Get and retain the web logs
We first ran our ERDDAP server on apache, then migrated to nginx. In both cases, it's essential to set the retention of your logs to a sufficiently long period such that the log files are not deleted during regular log rotation. I did this in nginx by setting rotate 3650 in the file /etc/logrotate.d/nginx. This sets the number of days to keep access logs from, in this case 10 years.
Alternatively, you could regularly copy the logs from your server to the computer you use for analysis with e..g rsync.
Data snapshot
137.184.165.96 - - [07/Jan/2023:00:04:37 +0000] "GET /erddap/tabledap/nrt_SEA056_M57.jsonlKVP?latitude%2Clongitude%2Ctime%2Cdive_num HTTP/1.1" 200 932348 "-" "axios/0.24.0"
137.184.165.96 - - [07/Jan/2023:00:04:37 +0000] "GET /erddap/tabledap/nrt_SEA045_M73.jsonlKVP?latitude%2Clongitude%2Ctime%2Cdive_num HTTP/1.1" 200 853145 "-" "axios/0.24.0"
185.191.171.4 - - [07/Jan/2023:00:05:46 +0000] "GET /erddap/tabledap/delayed_SEA066_M41.subset?.bgColor=0xffccccff&.click&.color=0x000000&.colorBar=%7C%7C%7C%7C%7C&.draw=markers&.marker=5%7C5&.viewDistinctMap=true&longitude%2Clatitude%2Ctime HTTP/1.1" 200 20272 "-" "Mozilla/5.0 (compatible; SemrushBot/7~bl; +http://www.semrush.com/bot.html)"
54.36.148.78 - - [07/Jan/2023:00:05:47 +0000] "GET /erddap/tabledap/delayed_SEA056_M54.graph?longitude,latitude,time&.draw=markers&.colorBar=%7CD%7C%7C%7C%7C HTTP/1.1" 200 30929 "-" "Mozilla/5.0 (compatible; AhrefsBot/7.0; +http://ahrefs.com/robot/)"
Step 1. Parse and combine logs
Weserver logs typically have a line by line structure with each line describing a user request. This will include the time of the request, the origin ip and the url requested. The log may also contain information like the user agent (e.g. "Firefox on a Windows PC"). We extract this data into a pandas DataFrame to make it easier to process.
The logs for apache and nginx are different, so some work is needed to combine them. The trickiest step, as is often the case in Python, was getting the timestamps into the same format.
With over 1 million lines of logfile, I started hitting a performance bottleneck with pandas, so I put my data in a polars dataframe, which gave a substantial speedup.
Data snapshop
┌────────────────┬─────────────────────┬───────────────────────────────────┐
│ ip             ┆ datetime            ┆ url                               │
│ ---            ┆ ---                 ┆ ---                               │
│ str            ┆ datetime[μs]        ┆ str                               │
╞════════════════╪═════════════════════╪═══════════════════════════════════╡
│ 54.36.148.29   ┆ 2023-08-13 00:03:31 ┆ /erddap/files/adcp_SEA045_M37/?C… │
│ 208.115.199.29 ┆ 2023-08-13 00:04:31 ┆ /erddap/index.html                │
│ 54.36.149.29   ┆ 2023-08-13 00:05:38 ┆ /erddap/metadata/iso19115/xml/nr… │
│ 54.36.148.227  ┆ 2023-08-13 00:07:37 ┆ /erddap/tabledap/delayed_SEA061_… │
└────────────────┴─────────────────────┴───────────────────────────────────┘
Step 2. Retrieve ip information
Several services can be used to fetch information on an ip address, including the approximate location, ISP, country and operating organisation. I used http://ip-api.com/. You can make up to 60 freee requests per minute using Python requests, and getting back nice structured json. I first sort the ip addresses by number of requests, so that we prioritise getting information from the visitors that have made the most requests to our site. We store the info and never request the same ip twice, so that over time we build the amount of information we have on the site's users.
Data snapshot
┌────────────┬─────────┬───────────┬───────────┬───┬───────────┬───────────┬───────────┬───────────┐
│ query      ┆ status  ┆ country   ┆ countryCo ┆ … ┆ timezone  ┆ isp       ┆ org       ┆ as        │
│ ---        ┆ ---     ┆ ---       ┆ de        ┆   ┆ ---       ┆ ---       ┆ ---       ┆ ---       │
│ str        ┆ str     ┆ str       ┆ ---       ┆   ┆ str       ┆ str       ┆ str       ┆ str       │
│            ┆         ┆           ┆ str       ┆   ┆           ┆           ┆           ┆           │
╞════════════╪═════════╪═══════════╪═══════════╪═══╪═══════════╪═══════════╪═══════════╪═══════════╡
│ 137.184.16 ┆ success ┆ Canada    ┆ CA        ┆ … ┆ America/T ┆ DigitalOc ┆ DigitalOc ┆ AS14061   │
│ 5.96       ┆         ┆           ┆           ┆   ┆ oronto    ┆ ean, LLC  ┆ ean, LLC  ┆ DigitalOc │
│            ┆         ┆           ┆           ┆   ┆           ┆           ┆           ┆ ean, LLC  │
│ 208.115.19 ┆ success ┆ United    ┆ US        ┆ … ┆ America/C ┆ Limestone ┆ null      ┆ AS46475   │
│ 9.29       ┆         ┆ States    ┆           ┆   ┆ hicago    ┆ Networks  ┆           ┆ Limestone │
│            ┆         ┆           ┆           ┆   ┆           ┆           ┆           ┆ Networks, │
│            ┆         ┆           ┆           ┆   ┆           ┆           ┆           ┆ Inc.      │
└────────────┴─────────┴───────────┴───────────┴───┴───────────┴───────────┴───────────┴───────────┘
Step 3. Combine requests and ip information
This is achieved with a classic dataset merge
df_pd = pd.merge(df_pd, df_ip, left_on="ip", right_on="query", how="left")
Now, all the requests from ip addresses that we have information for have that ip metadata added.
Data snapshot
┌────────────┬────────────┬────────────┬────────────┬───┬──────┬────────────┬─────────┬────────────┐
│ ip         ┆ datetime   ┆ url        ┆ query      ┆ … ┆ org  ┆ as         ┆ ip_root ┆ ip_group   │
│ ---        ┆ ---        ┆ ---        ┆ ---        ┆   ┆ ---  ┆ ---        ┆ ---     ┆ ---        │
│ str        ┆ datetime[μ ┆ str        ┆ str        ┆   ┆ str  ┆ str        ┆ str     ┆ str        │
│            ┆ s]         ┆            ┆            ┆   ┆      ┆            ┆         ┆            │
╞════════════╪════════════╪════════════╪════════════╪═══╪══════╪════════════╪═════════╪════════════╡
│ 208.115.19 ┆ 2022-09-16 ┆ /erddap/in ┆ 208.115.19 ┆ … ┆ null ┆ AS46475    ┆ 208.115 ┆ 208.115.19 │
│ 9.29       ┆ 08:19:59   ┆ dex.html   ┆ 9.29       ┆   ┆      ┆ Limestone  ┆         ┆ 9          │
│            ┆            ┆            ┆            ┆   ┆      ┆ Networks,  ┆         ┆            │
│            ┆            ┆            ┆            ┆   ┆      ┆ Inc.       ┆         ┆            │
│ 208.115.19 ┆ 2022-09-16 ┆ /erddap/in ┆ 208.115.19 ┆ … ┆ null ┆ AS46475    ┆ 208.115 ┆ 208.115.19 │
│ 9.29       ┆ 08:24:59   ┆ dex.html   ┆ 9.29       ┆   ┆      ┆ Limestone  ┆         ┆ 9          │
│            ┆            ┆            ┆            ┆   ┆      ┆ Networks,  ┆         ┆            │
│            ┆            ┆            ┆            ┆   ┆      ┆ Inc.       ┆         ┆            │
└────────────┴────────────┴────────────┴────────────┴───┴──────┴────────────┴─────────┴────────────┘
Step 4. Filter requests
There are many requests that we do not want to include in our analysis. These include requests from crawlers, which are indexing webpages for search engines like Google, services monitoring uptime, which periodically ping a site to check it hasn't crashed, and various bad actors probing a site for weaknesses, like a mistakenly uploaded credentials file. We remove this from our dataframe so that we only analyse requests from genuine visitors.
This is far from a foolproof method, but we don't need to be perfect. Here are some of the filters I use:
- Filter out requests from known crawlers, e.g. IPs from organisations with names including
["Google", "Crawlers", "SEMrush"] - Filter out any requests for files that aren't present on the server. Currently
".env", "env.", ".php", ".git", "robots.txt", "phpinfo", "/config", "aws", ".xml"] - Filter out reqeusts that do not contain "erddap". All genuine requests to the erddap server will contain this string
I log the percentage of requests removed by this filtering step. It's usually about one third of all requests.
Step 5. Analysis
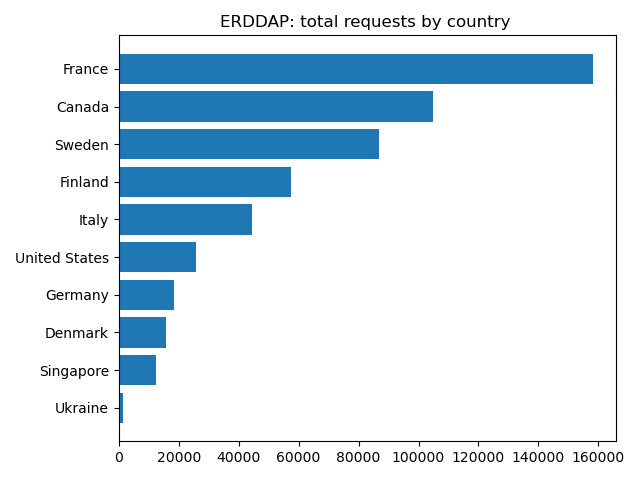
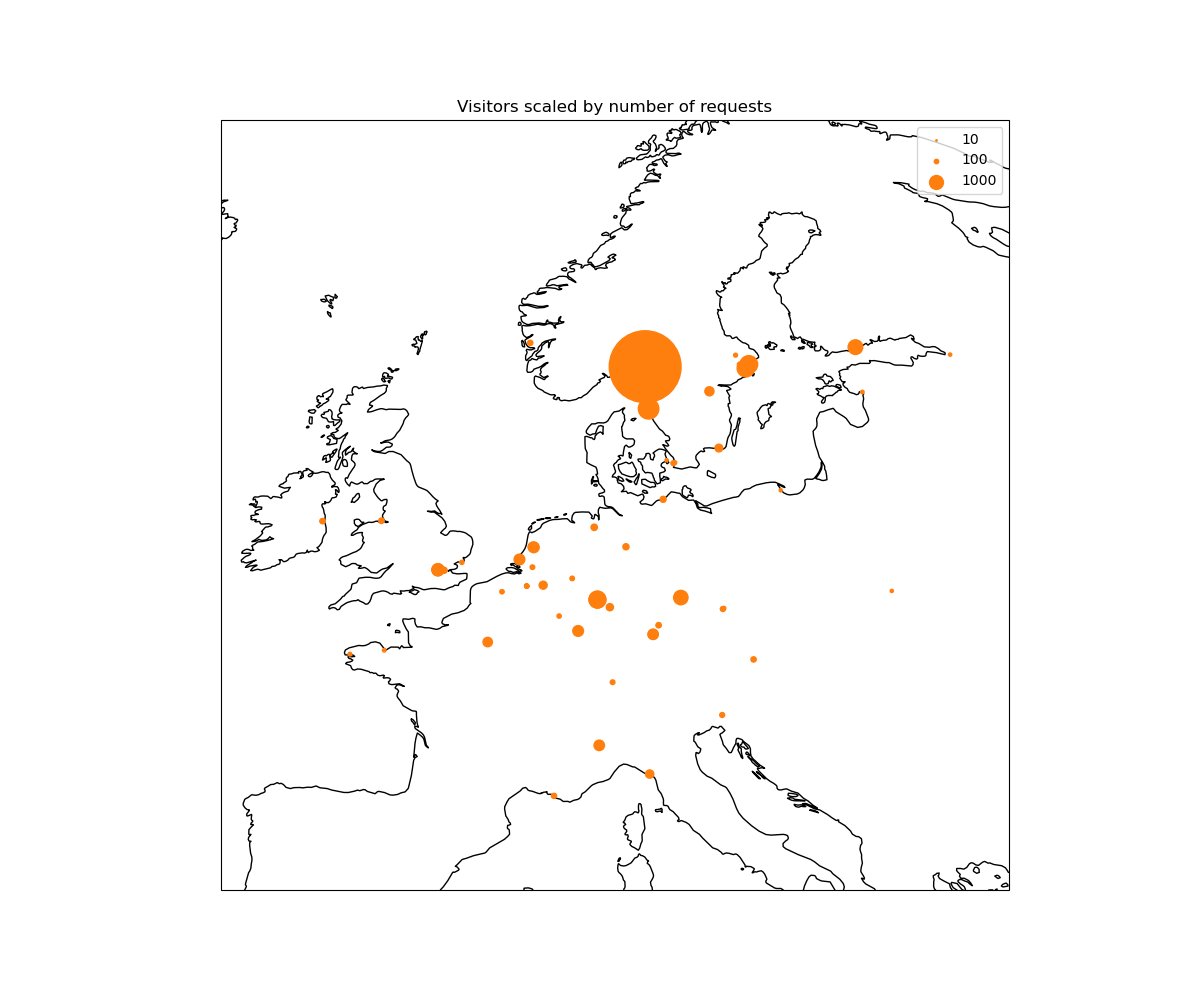
There is a lot of information in these requests! I currently look for a few things: - Where are requests coming from? - What pages are users visiting most? - What filetypes are users requests?
This last question is of interest for ERDDAP, as users may request difference download types like csv, netCDF, kml and others.
We make figures, inlcuding maps of where users come from and graphs of how the total number of request and daily unique users has changed over time.

